ValvAware™ Online Monitoring
The ValvAware Online Monitoring tool lets you monitor and diagnose the health of the valve.
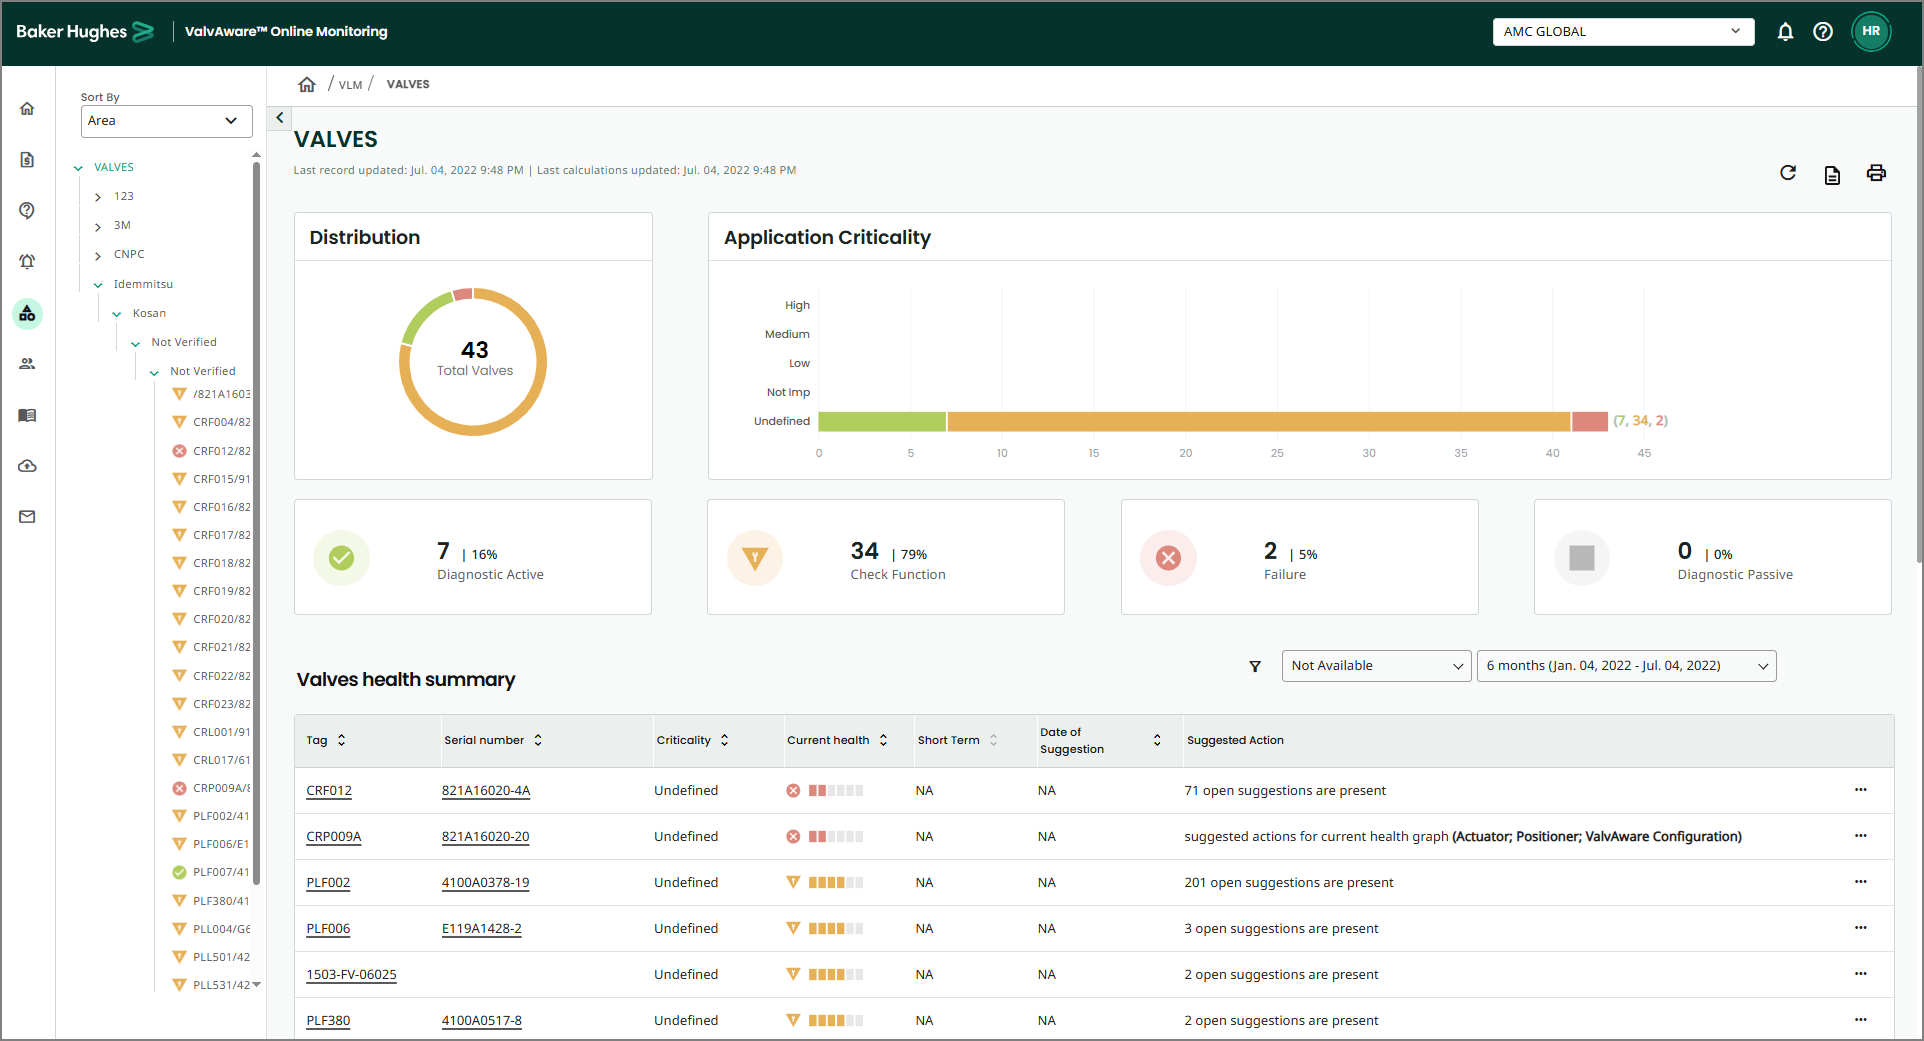
The left section contains a list of valves. The list is drilled-down as Customer > Plant > Unit > Location > Valves.
The condition of the valves is depicted in the sections to the right.
You can sort the left pane using the Sort By drop-down list.
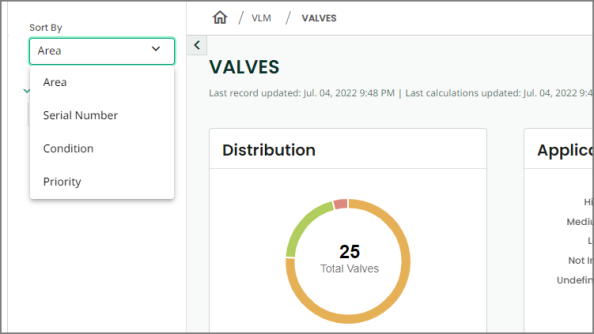
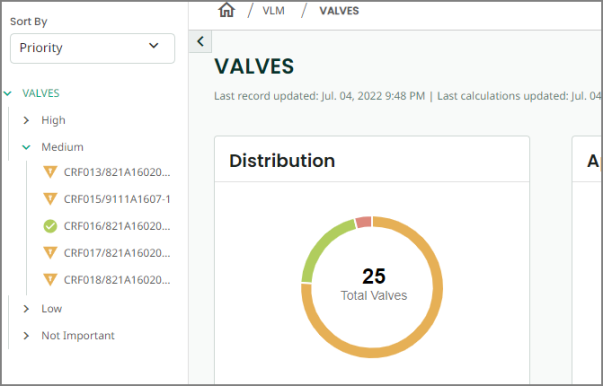
For example: On sorting by Priority, a list displays valves categorized under each priority–High, Medium, Low, and Not Important.

On expanding any priority, you will view all the valves falling under that priority. You can click any valve to view its detailed information.
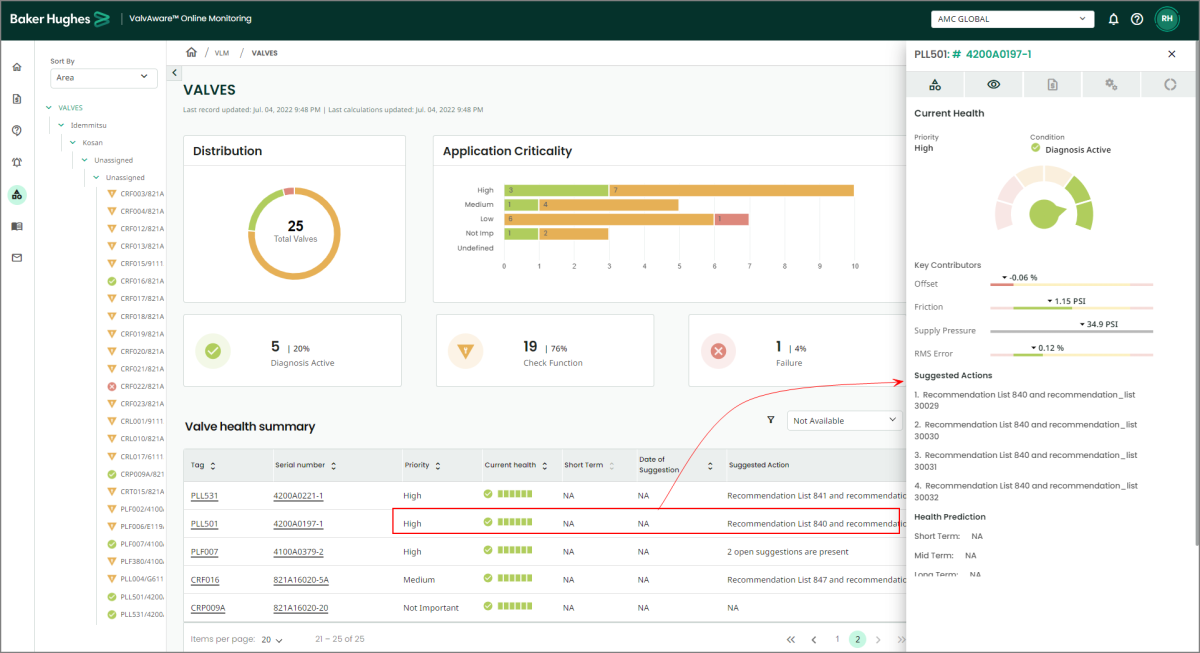
Distribution
In this case, there are total 25 valves, out of which:
-
5 are Diagnosis active - these valves are in active diagnosis
-
19 are Check Function - there is some issue with the valve, however it does not demand immediate attention
-
1 is failure - number of valves that failed
-
0 are diagnosis passive - valves that are in passive diagnosis
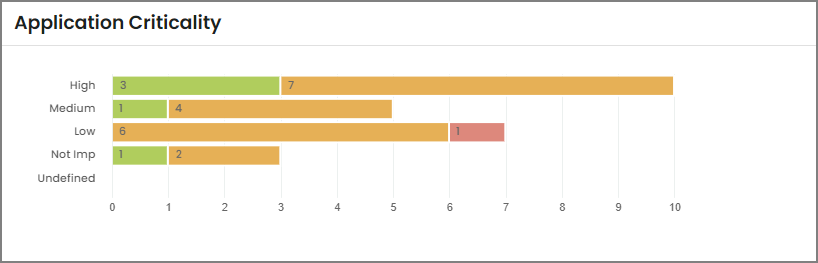
Application Criticality
Valve Health Summary
A Valve Health Summary page provides a complete overview of the selected valve. It includes information such as:
-
current health indicator
-
performance of the valve based on some of the standard KPIs
-
valve image (if available, else default standard graphics is shown)
-
suggested actions to improve the overall health of the valve
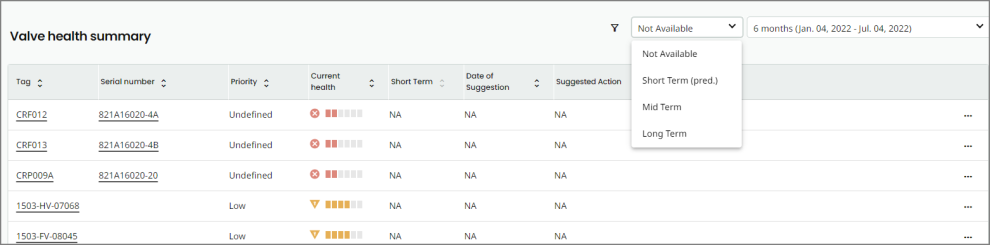
You can filter to view the Valve health summary table. You can choose from the kind of data to be displayed:
And, you can choose the date range to view the table:
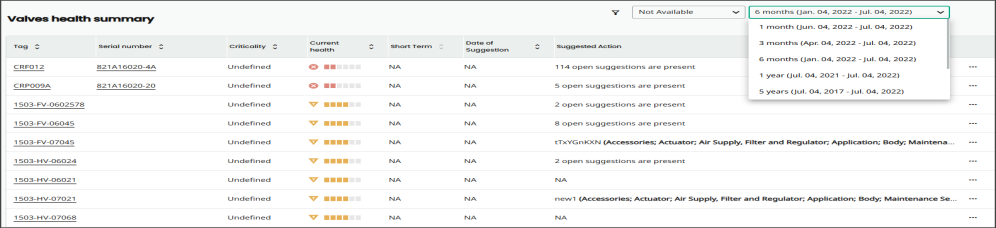
When you select a date range for a particular customer, say 3 months for customer A, the corresponding data for 3 months displays under the Valve Health Summary section.
You will see the same date range (3 months, in this case) applied at Unit and Valve levels in the hierarchy for that customer.
If there are multiple units under one customer, then changing the filter in one unit changes the filters in all of them.
To take a quick look at the Valve Health Summary, click any item in the Priority through Suggested Actions columns, for that valve. A pane displays at the right that contains health summary of the selected valve.
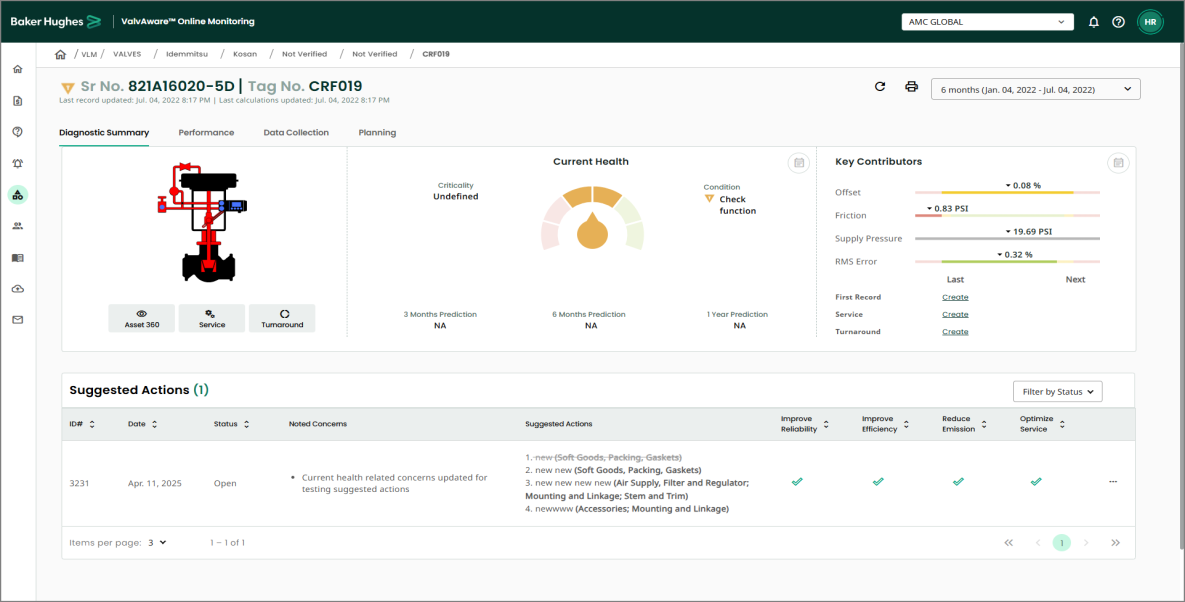
Now click either value in Tag or Serial Number for a valve. You will be navigated to the valve details page, where you will see 4 tabs—Diagnostic Summary, Performance, Data Collection, and Planning.
You will also view refresh and print icons and a time span list.
-
Clicking the refresh icon will refresh the page.
-
Clicking the print icon will print the page you are at in the application.
-
Clicking the time period dropdown lets you select the required period for which you want to view the data.
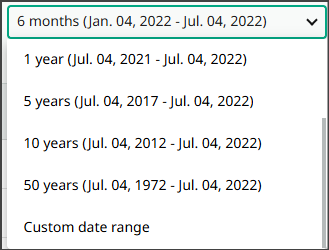
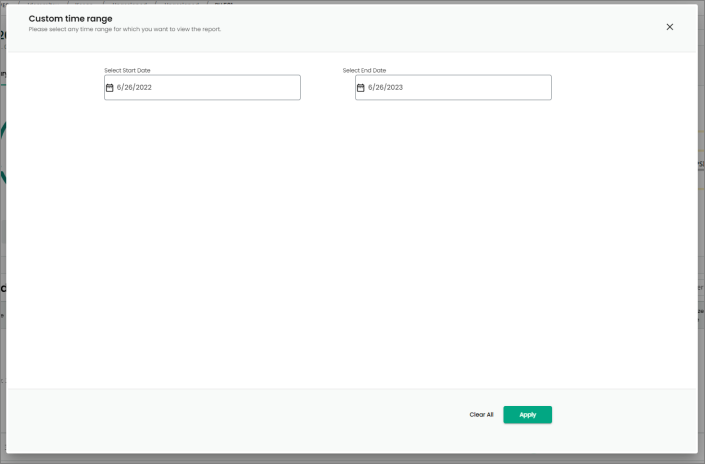
-
Selecting Custom date range opens the dialog box, where you can select the start and end date and click Apply.
Icons on the Valves page
![]()
1. Refresh:
The refresh icon lets you refresh the page.
If you have applied filters on the page and zoomed any graph, and clicked refresh, all the filters applied will be retained. However, the zoomed graph will be reset to its original view.
2. Print Page:
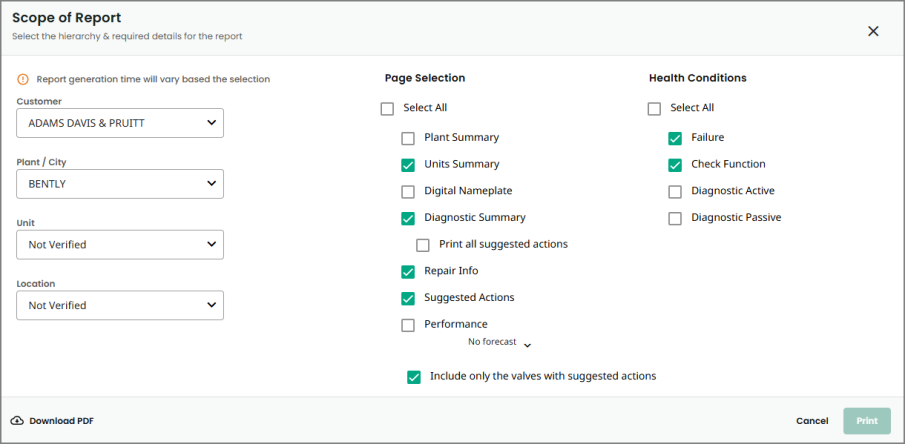
The Print Page icon allows you print the fleet report. Clicking the icon opens the Scope of Report dialog box.
Basis your selection, a report will be generated that you can download and, eventually, print.
-
Select the required Customer, plant/City, Unit, Location.
-
Under Page Selection, select the required option(s), or you can choose Select All.
-
Under Health Conditions, select the required option(s), or you can choose Select All.
Note: If you select a hierarchy in the Valves pane, for example, a customer and plant, it will be pre-populated and you will not be able to select.
In other words, based on the hierarchy in the Valves pane, the dropdown fields will be pre-populated and disabled.
Once you select the required options, click Print. The report generation process begins.
Note: Notice that the Print Page icon turn gray once the report generation begins. You will not be able to print another report if the previous report generation operation is in progress.
Note: You cannot generate a new print report until you download the previous one.
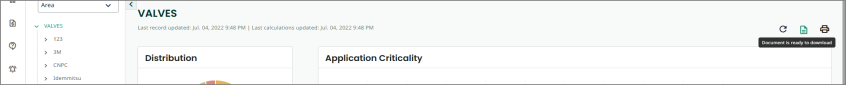
When the report is generated successfully, it is now ready for download and print.
Note: The tooltip of the Print Page icon is now changed to Document is ready to download.
-
Click the icon again, and you will see the Download PDF button is now enabled. You will not be able to print the report until you download it first.
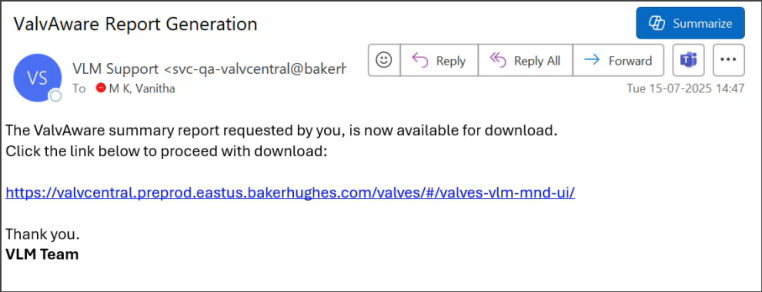
Note: You will also receive an email when the report is available for download.
-
Once the report is downloaded, the Print button is enabled. Click Print to print the report.
3. Print:
The print icon lets you take the print of the current page you are at in the application.
Note: The refresh and print functions are present in all the tabs - Diagnostic Summary, Performance, Data Collection, and Planning.